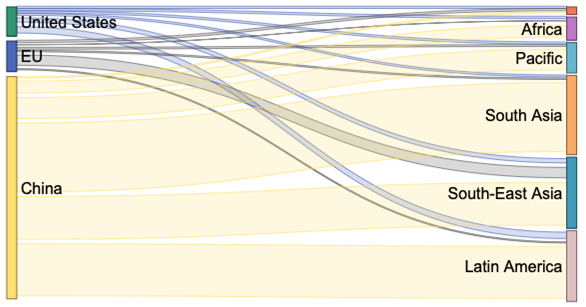
But China asserted its role as the main source of environmental goods to the other regions, with the exception of the Caribbean.
Learn More >Latin America followed, receiving ~20% of the total. South Asia and South-East Asia received ~17 and 7%, respectively.
Learn More >Among the key players in Europe, Germany leads in exports of solar panels, electric vehicles and wind power
Learn More >However, it should be noted that the leading recipient of mobilised private finance varied a lot across the years.
Learn More >… with India (97.71 bn), Brazil (85.68 bn), Mexico (76bn) and Singapore (67.09bn) representing the biggest importing markets.
Learn More >Africa has received steadily increasing volumes of both adaptation and mitigation finance over time, with adaptation gradually gaining ground and reaching parity with mitigation by 2020.
Learn More >Note: it is important to highlight that, given the study focuses only on exports from the EU, UK, China, and the US, it excludes other major players in the trade of environmental goods, including Japan, South Korea, and countries in Southeast Asia.
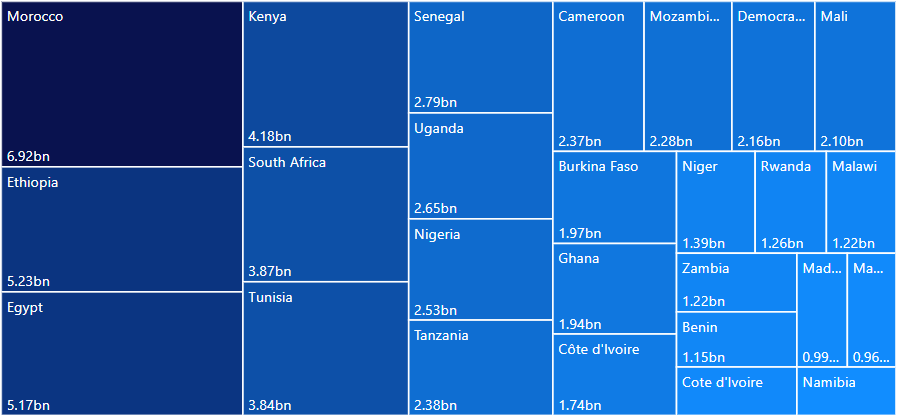
Trade flows in environmental goods for Africa by exporter
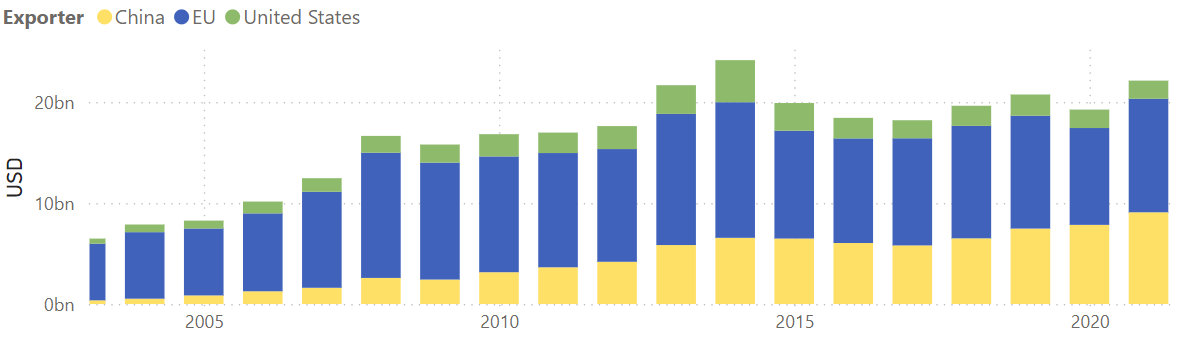
Source: IMF Bilateral Trade in Environmental Goods
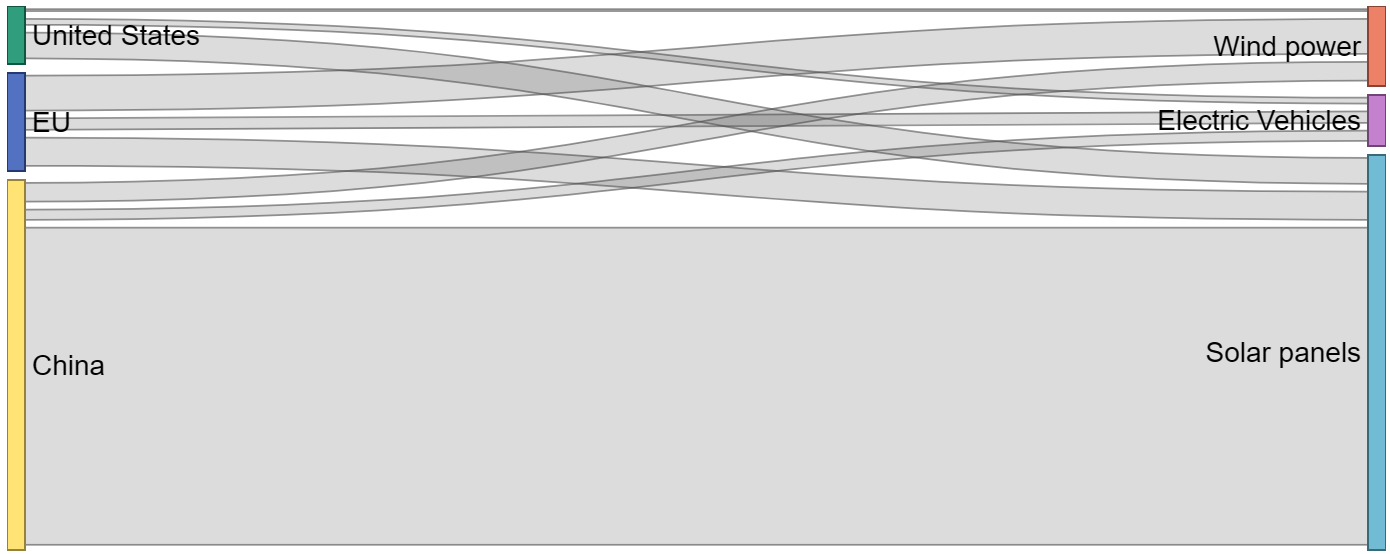
Main Source of Environmental Goods Exports to Africa, Cumulative total (in USD)
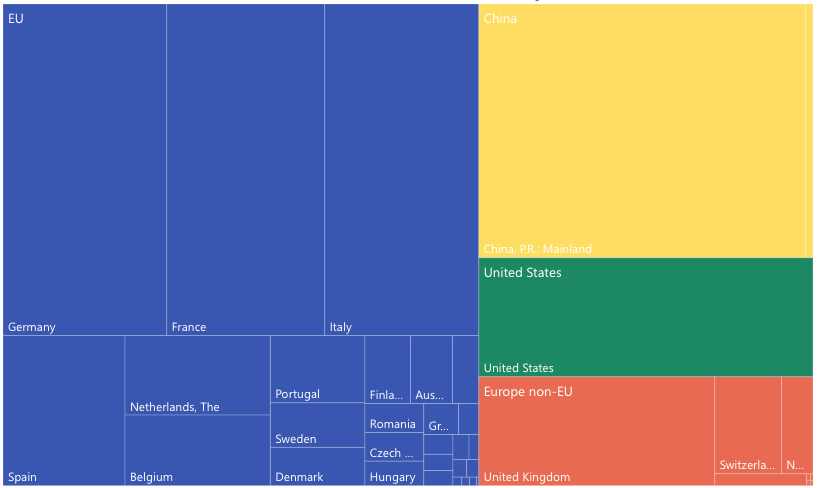
Sources: IMF bilateral trade in environental goods
Note: it is important to highlight that, given the study focuses only on exports from the EU, UK, China, and the US, it excludes other major players in the trade of environmental goods, including Japan, South Korea, and countries in Southeast Asia.
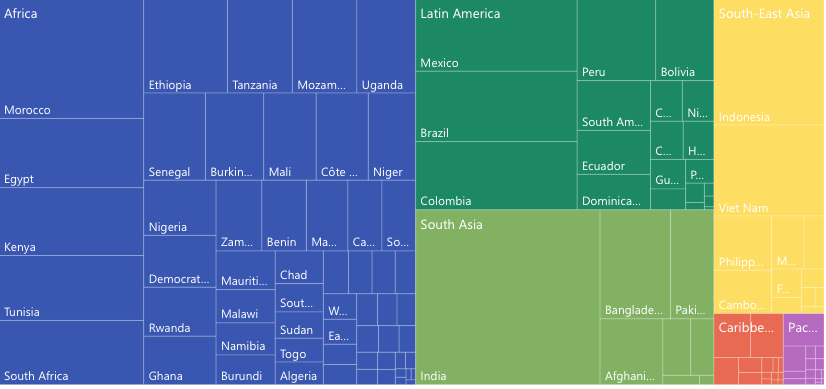
Historical imports of environmental goods by Africa, disggregated at country level
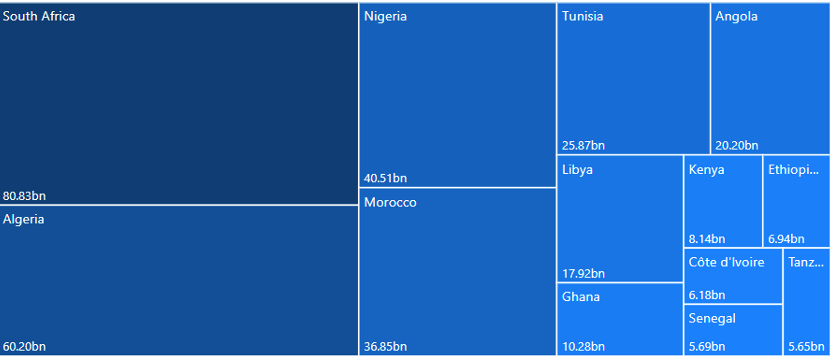
Sources: IMF bilateral trade in environental goods

Deployment of public climate-related development finance to Africa, yearly total amount, USD
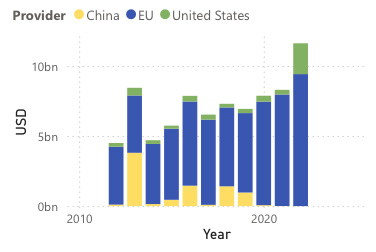
Source: OECD Devlopment Finance for Climate and Environment, and AidData's Global Chinese Development Finance Dataset
Note: The EU aggregate represents the sum of Member States and Institutions
Private finance mobilised by bilateral climate finance in Africa, yearly amounts by provider
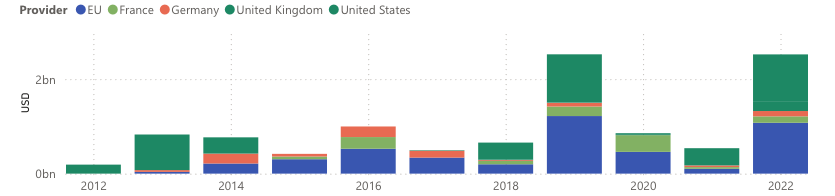
Sources: OECD mobilised private finance for development
Note: The EU aggregate represented the additon of Member States and Institutions
Depending on the year analysed, different countries emerge as the largest recipients. Increases in one country are often offset by decreases in subsequent periods, demonstrating the high volatility and shifting regional focus of this support. There is no evidence of any single country becoming the primary focus of bilateral public climate finance.
Historical bilateral public climate finance received by Africa, disaggregated at country level
Source: OECD Development Finance for Climate and Environment, and AidData's Global Chinese Development Finance Dataset
While the EU remains the leading provider of both environmental goods and climate finance to Africa, these two channels often operate in parallel rather than in synergy.
Leveraging the EU’s commercial footprint in environmental technologies – particularly in countries like South Africa, Nigeria, and those in the Southern Neighbourhood – can enhance the impact of climate-related investments, contribute to long-term green industrial development in partner countries, and, importantly, support the EU’s own competitiveness goals through value chain diversification and resilience, in line with the recently launched Clean Industrial Deal.

by identifying priority sectors and countries where clean technology exports can complement and reinforce climate finance interventions.
for climate-aligned trade and investment through regulatory cooperation, technical assistance, and capacity building. These efforts should be embedded within broader partnerships supported by the Global Gateway, and more specifically, by the development of Clean Trade and Industrial Partnerships (CTIPs).
ensuring that EU trade and finance flows are consistent with nationally determined contributions (NDCs), country platforms, and green industrial strategies. This approach can strengthen ownership and ensure that EU support aligns with partner countries’ visions for a just and inclusive green transition.

This dominance became particularly pronounced from 2015 onwards, peaking in 2021. Electric vehicles (EVs) represent the second-largest export category, with China again leading, closely followed by the EU. Although the EV market is growing rapidly, export volumes remain below those of solar panels, suggesting that demand for electric vehicles in developing countries is still maturing. Wind power technologies are the third most exported category, and in this area, the EU leads in cumulative exports. While the EU dominated wind power exports from 2012 to 2021, China overtook it in 2018, reflecting shifting global competitiveness in the sector.
Exports to developing countries of selected environmental goods (in USD)
Source: UNCOMTRADE
Although EU currently remains close to China in the EV market, we have seen a steep increase in exporting activity from China in the last 2/3 years which could signal potential changes in the future market. In other words, this reflects the point that if we continue along the current trajectory, China will soon dominate the EVs market.

Private finance mobilised by bilateral climate finance in Latin America: yearly amounts by provider
Sources: OECD mobilised private finance for development
Note: The EU aggregate represented the additon of Member States and Institutions
Mitigation finance has consistently outpaced adaptation finance in Latin America since 2010, with the bulk of climate funding directed to the energy sector, followed closely by general environmental protection. The latter has been significantly supported by US funding, often channelled toward conservation and ecosystem preservation. The primary recipients of European public climate-related development finance in the region during the observed period were Mexico, Brazil, Colombia, Peru, and Bolivia.
Main destinations of EU bilateral public climate-related development finance: combined total (in USD)
Source: OECD Development Finance for Climate and Environment, and AidData's Global Chinese Development Finance Dataset
In the case of wind power, Latin America is again the primary destination, with the Pacific and South-East Asia also registering high import volumes. While EU exports dominate in Latin America, demand in the Pacific and South-East Asia is now met by both the EU and China in roughly equal measure.
For electric vehicles, the Pacific region is currently the largest importer, followed by South Asia and Latin America. China is the main EV supplier to South Asia, while the EU leads in exports to Latin America. Though overall demand for EVs remains lower than for solar panels, the growth in exports reflects an emerging interest in sustainable mobility, with the Pacific acting as an early adopter.
For wind power, Latin America is again the primary destination, with the Pacific and South-East Asia also registering high import volumes. While EU exports dominate in Latin America, demand in the Pacific and South-East Asia is now met by both the EU and China in roughly equal measure.
Key technologies trade flows from exporters to importers:
Solar panels (in USD)
Source: UNCOMTRADE
Key technologies trade flows from exporters to importers:
Electric vehicles (in USD)
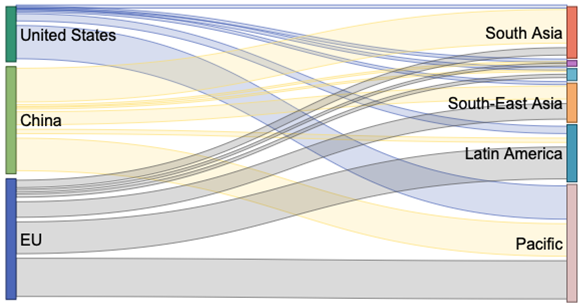
Source: UNCOMTRADE
The EU should build on its strong position as a leading provider of mobilised climate finance in Latin America by deepening industrial partnerships around clean energy technologies and sustainable transport. While China leads in solar panel exports, the EU has competitive advantages in wind power and electric vehicles — both of which align closely with Latin America’s mitigation priorities, particularly in the energy and transport sectors.
to strengthen clean energy value chains and promote industrial development in Latin America. These could include local EV assembly, grid expansion, wind and hydrogen infrastructure, ensuring projects deliver both decarbonisation outcomes and socio-economic benefits.
as a strategic opportunity to launch new partnerships in these areas, ensuring alignment with the region’s priorities for a just and sustainable transition.
that align public climate finance with the deployment of EU-manufactured clean technologies to the region.

Total EU bilateral public climate-related development finance by objective (in USD)
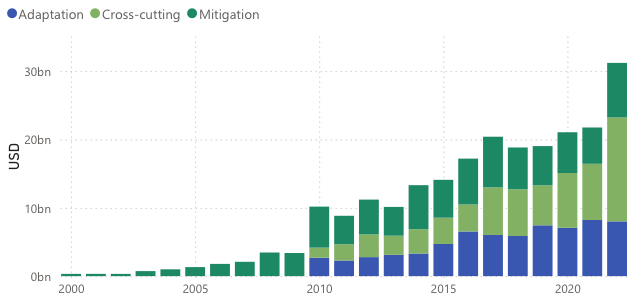
Sources: OECD development finance for climate and environment
Note: Selecting both the EU27 and EU institutions represents the "EU" aggregate presented in other figures. The figure represents the amount of finance for a specific objective including cross-cutting support - which includes projects which are both adaptation and mitigation.
In contrast, the United States continued to focus predominantly on mitigation across most of the observed period. Adaptation finance remained comparatively limited until 2022, when a sharp increase made it the dominant focus. This shift likely reflected renewed commitments to climate action under the 2021–2024 US administration, accompanied by expanded pledges and multilateral engagement.


Africa has received steadily increasing volumes of both adaptation and mitigation finance over time. While mitigation was the primary focus until 2010, adaptation finance gradually gained ground and reached equal levels by 2020. This growing balance highlights the continent’s dual need for urgent adaptation to climate impacts and sustained investment in low-carbon development.
In Latin America, mitigation finance has consistently exceeded adaptation finance since 2010, largely driven by efforts to address emissions from energy, deforestation, and agriculture. Similarly, South Asia and South-East Asia have also seen mitigation dominate throughout the observed period.

In the Pacific region, adaptation finance has consistently surpassed mitigation finance, reflecting the region’s acute vulnerability to climate impacts such as sea-level rise and extreme weather events. Nevertheless, some fluctuations occurred during 2016–2018, when mitigation finance temporarily exceeded adaptation.
(e.g. the Sahel, Horn of Africa).
ensuring alignment with African National Adaptation Plans (NAPs), NDCs, and broader development strategies.
By proactively shaping new climate partnerships, the EU can strengthen economic ties, enhance supply chain resilience, and secure access to critical raw materials essential for its own energy transition. Fostering sustainable growth in developing countries also helps mitigate geopolitical instability, reduces migration pressures, and expands markets for European green technologies and investments.

Climate finance is often shaped by international commitments, while trade responds to commercial logics and industrial competitiveness. Yet both can contribute to the climate transition in developing countries. Aligning them more strategically is essential for enabling systemic change. Trade flows must be underpinned by finance that supports capacity building, regulatory alignment, and downstream participation in clean value chains. Climate finance, in turn, should be designed with a long-term perspective, enabling access not just to technologies but to the markets, investment, and innovation ecosystems that sustain clean industrial development.
Future EU strategies should aim to integrate these domains more cohesively, leveraging instruments such as the Global Gateway to facilitate Clean Trade and Industrial Partnerships that are equitable and transformative. This includes aligning export promotion with local development goals, supporting clean production standards, and ensuring that climate finance flows empower domestic industries and institutions in partner countries. Not doing so risks giving room to other global players who are increasingly positioning themselves as partners of choice in climate and economic development for emerging countries.

Addressing these gaps will be essential to deepen understanding of how financial and commercial engagements translate into measurable decarbonisation outcomes. Future analysis should aim to cover a broader set of environmental goods that reflect emerging priorities in the green economy. Finally, integrating partner country perspectives will be critical to ensuring that climate cooperation is both effective and equitable.